Description
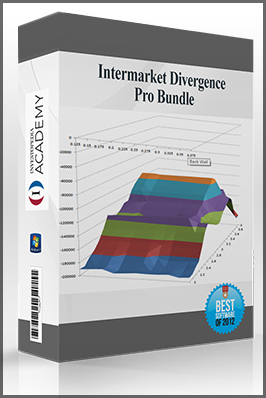
Intermarket Divergence Pro Bundle
Sale Page : usingeasylanguage
This product will available in 8 – 14 days later after you pay.
Intermarket analysis is an incredibly powerful concept that traders can use to get an edge on the market. In fact, when intermarket analysis is done correctly it is considered to be a form of statistical arbitrage that can have excellent results.
Readers of System Trader Success know that Jeff Swanson is very interested in intermarket analysis as a method to incorporate into his own systems. In fact, Jeff has been using our Intermarket Divergence Pro tool and has found it to be beneficial.
Designed exclusively for TradeStation users such as yourself, this intermarket divergence tool works by allowing you to easily – and without any code – test various intermarket hypothesis. For example, with Intermarket Divergence Pro you can test hypotheses such as “are bonds positively correlated with utility stocks?” without any coding. In the two videos below, Murray shows exactly how to test that exact hypothesis and also how to use the program to filter for seasonal weaknesses in bonds.
How Does Intermarket Divergence Work?
Intermarket divergence is based on six basic fundamental ideas:
- All markets are interrelated. This means that no markets ever move in isolation.
- Intermarket work provides important background data.
- Intermarket work uses external, as opposed to internal, data.
- Technical analysis is the preferred vehicle.
- Intermarket relationships are not only for futures, but also for stocks, ETFs, and various indices or sectors.
- We will first try to understand the premise behind a relationship. This means viewing it visually on a chart and then developing mechanical signals based on this relationship.
The last point is especially important for building robust systems. It is imperative that no matter what you choose to trade, you understand the premise of the system. For example, trading soybeans to copper doesn’t have much of a logical premise, but the relationship between the dollar and stock prices does. As the dollar weakens, exports become cheaper for foreign persons which is good for U.S.-based international companies. Conversely, as the dollar strengthens, exports become more expensive and this results in a harder sell for U.S. businesses. This is a very, very simple example, however it illustrates the point well that we need to have a good premise for our systems. The secret then to doing intermarket analysis right is to demonstrate that intermarket relationships exist, why they exist, and how they can be incorporated into our technical work to predict future price moments.
When we have such a correlation we can use it to predict future price movements. As Murray showed in the two videos above, we can find such a correlation in the bond and utility markets. If utilities are on an upward trend and bonds are on a downward one, we would expect to see bonds eventually correct back upwards. If you buy at the low point and sell at the high, you’ve just put intermarket divergence to work for your account!
Using Our Software
The Intermarket Divergence Pro software that is sold on the site is very powerful for testing these hypotheses quickly and easily. It can be used to build systems in a short amount of time that get you a working system in a fraction of the time that it would take to actually code everything from scratch in TradeStation. When you’re confident that you’ve hit a good intermarket correlation, you can then extend the system via EasyLanguage (we sell a book on this site that can help you brush up on your EasyLanguage skills!) to filter trades and so on. Indeed, one of the powerful things about Murray’s Intermarket Divergence Pro utility is that it is completely open-source. It is a powerful learning resource both from a code side and a market research side.
System Robustness
For readers of System Trader Success, we are not only giving away the Intermarket Divergence Pro utility for a reduced price, but we are also throwing in a completely free copy of Murray’s 3D optimization utilities for Excel (this normally retails for $69 alone on our site). It is very important to ensure that your system is very robust. One of the ways in which Murray ensures this in his own systems is to visualize the 3D parameter space and calculate statistical significance. This utility works for TradeStation outputs meaning you can use it with the Intermarket Divergence Pro utility.
Visualizing the 3D parameter space is an important part of ensuring your system is robust. You do not want to trade a system for which only only a couple of parameter choices work. Rather, you want a solid premise so that you have quality returns across a wide range of parameters. With Murray’s tool, you can visualize two parameters on the X and Y axes and net profit or net profit to drawdown on the Z axis. This helps ensure that your system is robust and that it’s not a fluke that say param1 = 2 and param2 = 4 works but everything else fails miserably. This helps you, as system designer, see trends.
One of the other things that this utility offers is the ability to calculate statistics in order to see if the results we are experiencing are statistically significant or not. We can calculate the means and standard deviations for our systems to ensure that they are robust and will hold up in out-of-sample testing.
Put Intermarket Divergence to Work for You
This package will only be available on this site for the next 5 days so act fast! For just a one-time payment of $299, you can get:
- Intermarket Divergence Pro – for TradeStation users (normally $249).
- 3D Optimization – Excel add-in (normally $69).
Normally this would cost $318 to buy separately, but we are giving you the opportunity to own both for less! For just $299, you can be on your way to using intermarket divergence in your own strategies and research!


